


 86 / 93

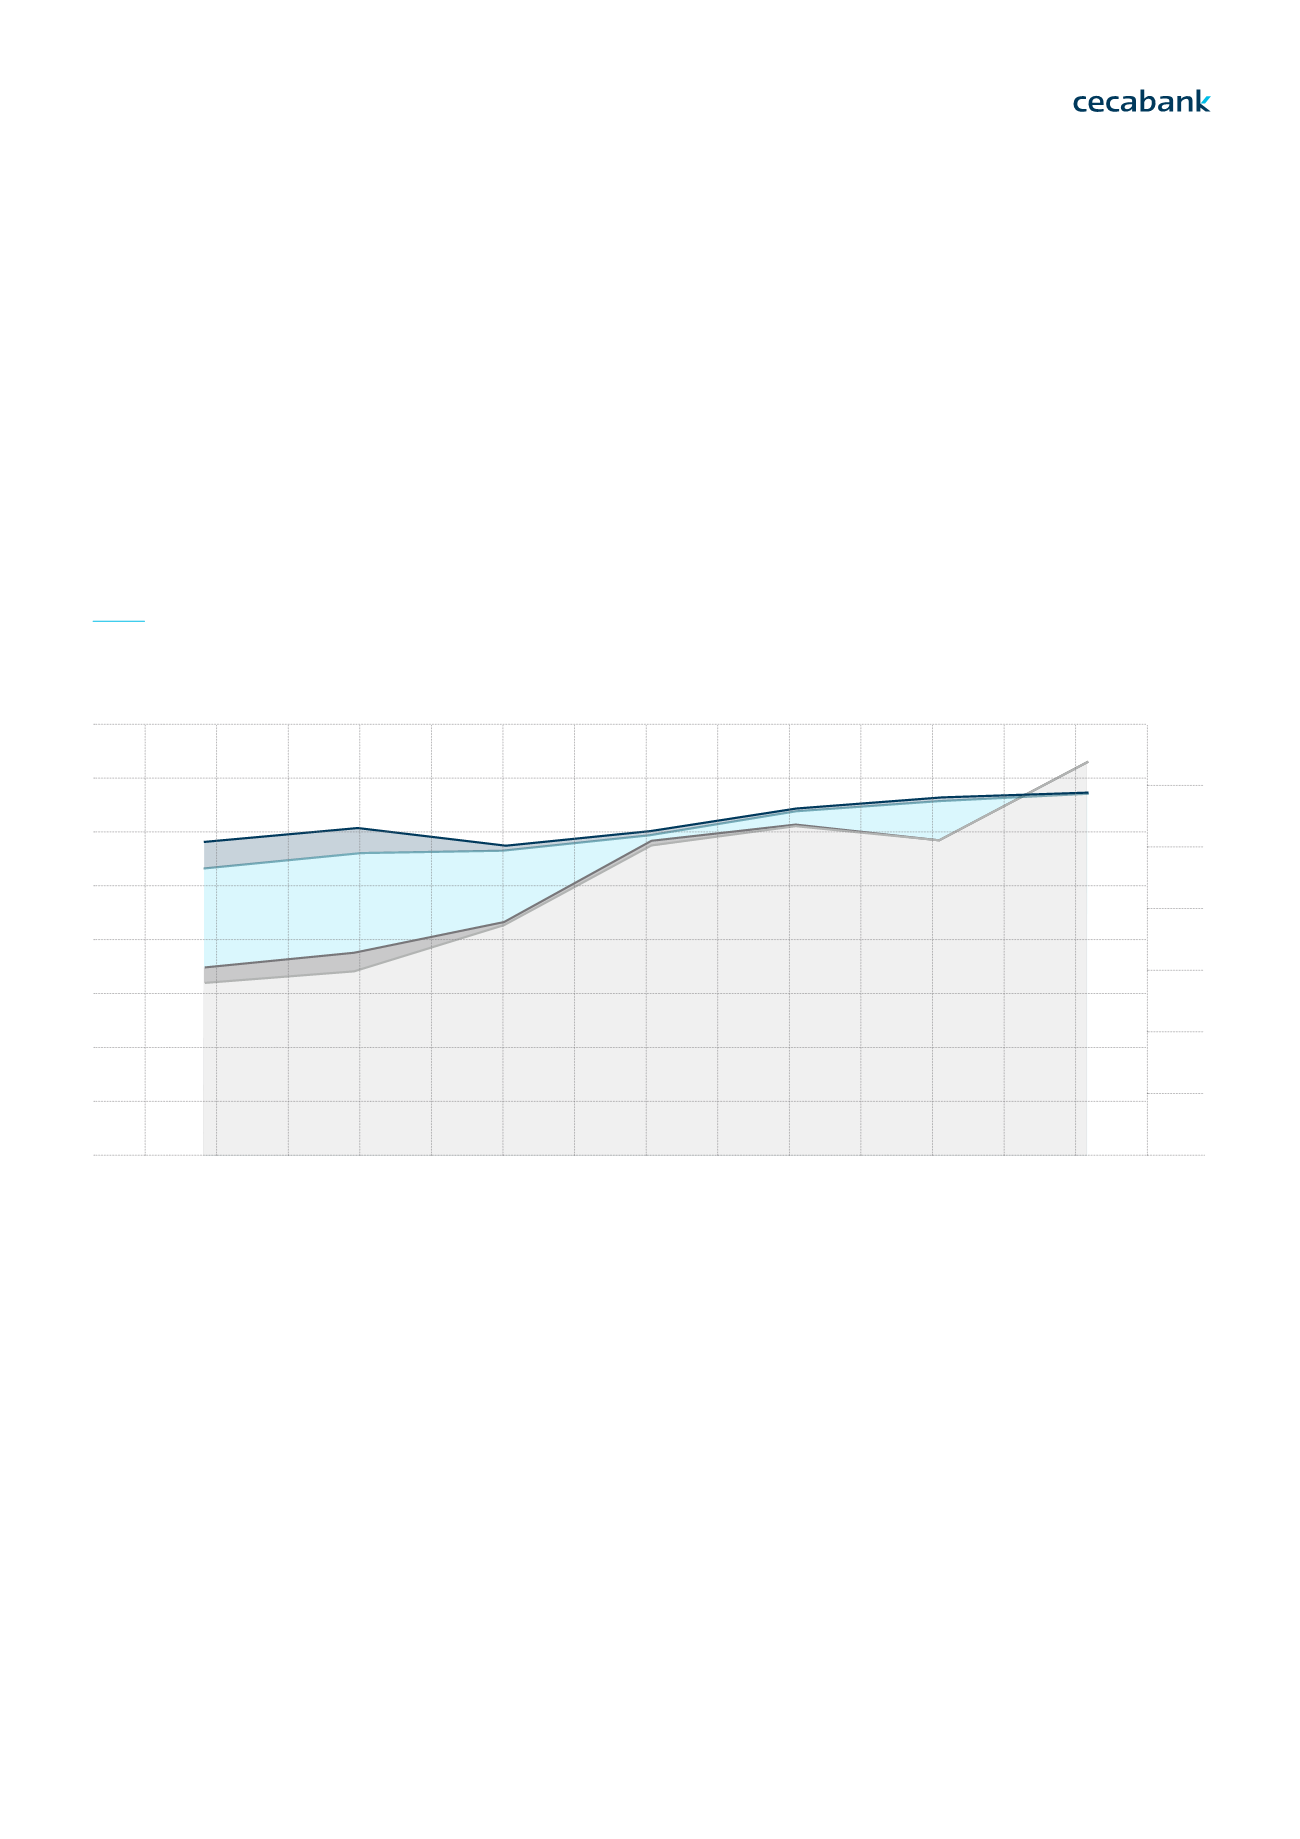
Robust capitalisation
At the close of the 2016 financial year Cecabank’s solvency ratio stood at
31.65% with 99.8% of capital being common equity Tier 1 capital, i.e. the
Tier 1 ratio stood at 31.58%.
A key factor for management is keeping a sound capital structure in terms
of quantity and quality. As a result (and as reflected in the graph) in recent
years, the Tier 1 capital base has been progressively strengthened through
the capitalisation of profit which, together with the maintenance of low risk
levels, has enabled a sustained improvement in capital ratios over time.
TIER 1 CAPITAL
TIER 1 CAPITAL
TIER 2 CAPITAL
TOTAL CAPITAL RATIO (RIGHT SCALE)
TIER 1 CAPITAL RATIO (RIGHT SCALE)
1,000
30%
20%
10%
0%
750
500
250
0
2010
2011
2012
2014
2016
2013
2015
Cecabank
2016 Annual Report
Page. 86
06 FINANCIAL INFORMATION
6.1
. Financial information | Results | Activity | Robust capitalisation | Ratings6.
2. Risk management | Structure and organisation | Assets and Liabilities Committee | The Compliance and Operational Risk Committee