


 67 / 76

Page. 67
Cecabank
2015 Annual Report
875.000
750.000
25
675.000
500.000
20
375.000
250.000
15
125.000
0
10
Capital base
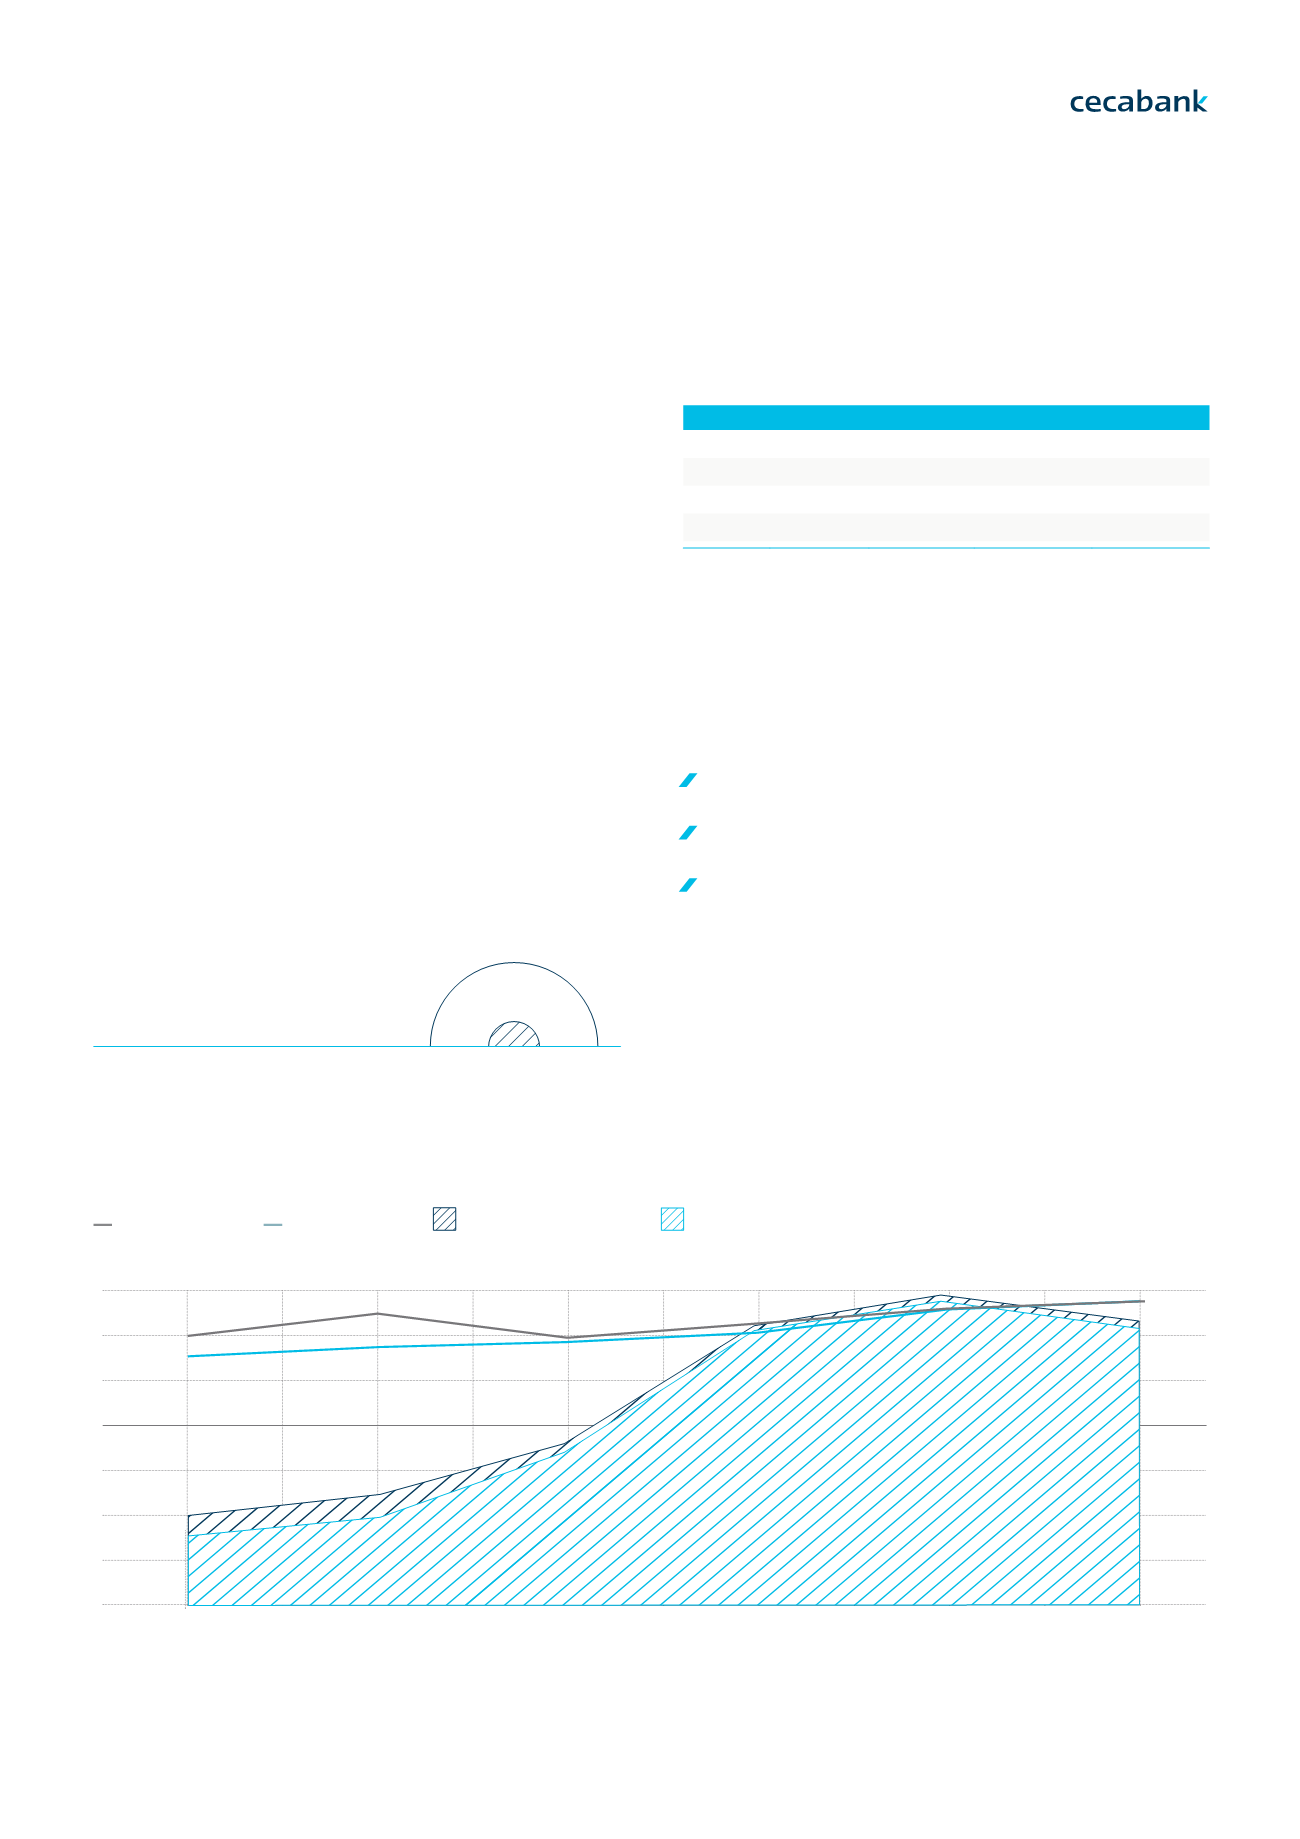
At the end of financial year 2015 Cecabank’s solvency
ratiowas of 25.33%, with99.4%of capital being common
Tier 1 capital, i.e. the Tier 1 ratio stood at 25.18%.
A key element in management was and is to maintain a
sound capital structure in terms of quantity and quality.
Cecabank’s Board of Directors established a minimum
capital ratio of 14%. This ratio is established in terms
of Common Equity Tier 1 (CET1). In addition, the Risk
Tolerance Framework establishes a wide margin for this
ratio which the entity must use for operating in normal
situations. Both levels are currently easily surpassed.
Cecabank’s comfortable solvency position enables it to
cover present and future capital requirements and the
risks not considered in Pillar 1. Moreover, these ratios
are lower than would be obtained by applying the
solvency regulations without transitory clauses (fully
loaded Basel III).
Ratings
As of 31 December 2015, the ratings Cecabank had been
given by the international rating agencies, Fitch Ratings,
Moody’s y Standard & Poor’s, are as follows:
Cecabank
Agency Short term Long term Outlook
Date
Moody´s
P-2
Baa2
stable 17/06/2015
Fitch
F-2
BBB-
stable 04/11/2015
S&P
A-2
BBB
stable 02/02/2016
The strategic reorientation and the success of its
implementation were key factors in the upgrading of the
different agencies’ credit ratings and now all three ratings
are Investment Grade. In general, when rating our bank,
the agencies highlighted the success of the following as
positive elements:
The liquidity position
The strategic reorientation of the bank
The conservative risk profile
2010
2011
2012
2013
2014
2015
Tier 1 capital
CET 1
25.33
%
Eurozone average: : (September 2015)
13.05
%
Total capital ratio
Tier 1 capital ratio
Tier 2 capital
Tier 1 capital
1. Strategic lines | Economic and regulatory enviroment | Building the future | Business lines 2. Financial information | Activity |I
ncome Statement | Capital base | Ratings 3. Business risk | The risk function at Cecabank03 Our Business Model