


 31 / 76

Page. 31
Cecabank
2015 Annual Report
Strategic lines
Economic environment
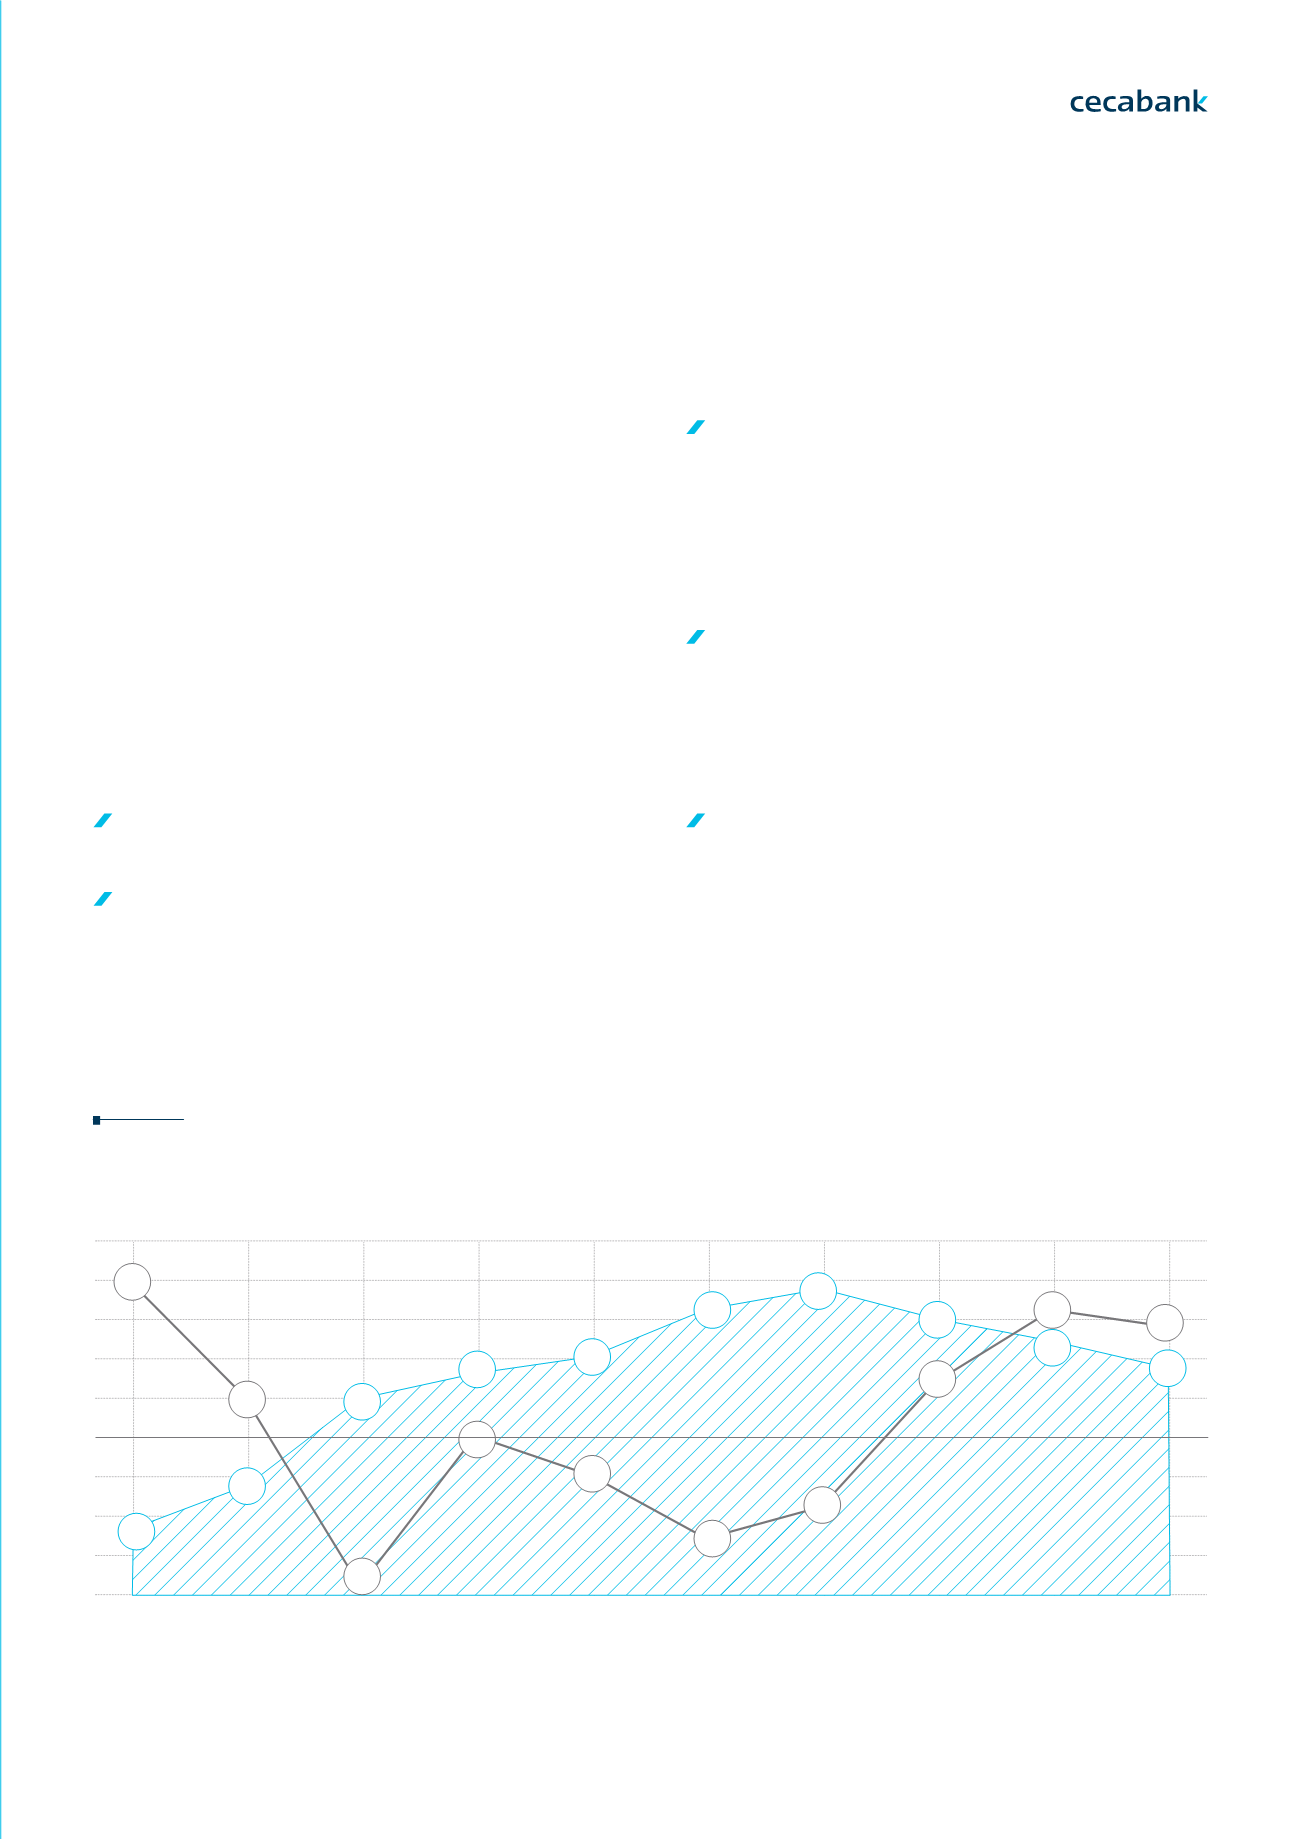
After five years of economic recession, in 2015 the
Spanish economy consolidatedthe recovery trend which
started at the end of 2013 and registered GDP growth
of 3.5 per cent in the fourth quarter of the year, almost
doubling average growth in the eurozone.
However, quarterly economic growth slowed slightly in
the second half of the year and this will be the trend in
2016. Funcas’ forecasts estimate 3.2 per cent growth
for 2015 as a whele and 2.8 per cent in 2016. Amongst
the reasons for these projections for slower Spanish
economic growth are:
The deceleration of world growth and world trade,
especially in the emerging bloc.
The lesser impact of some favourable events which
occurred in the first half of 2015, such as the
downturn in oil prices and the tax policy.
Economic and regulatory environment
The increased uncertainty associated with the
new election process in Spain and external
geopolitical factors.
Despite the more buoyant Spanish economy, the
sitution of the labour market and the high volumen
of public debt are particular causes for concern.
The unemployment rate reached a high in 2013, at
just over 26 per cent, but has started to gradually
fall since then, albeit at a very moderate rate.
Funcas’ forecasts put unemployment at around 20
per cent in 2016, still a far cry from the 8 per cent
registered before the crisis.
The public debt rate was around 100 per cent of the
GDP in 2015, which makes it a vulnerable element
in the Spanish economy if there were to be any
disturbances in the interenational financial markets.
he public debt rate was around 100 per cent of the
GDP in 2015, which makes it a vulnerable element
in the Spanish economy if there were to be any
disturbances in the interenational financial markets.
GDP growth and unemployment in Spain
Source: FUNCAS
5
30
4
27
3
24
2
21
1
18
0
15
-1
12
-2
9
-3
6
-4
3
2008
2007
2009
2010
2011
GDP
(annual change)
Unemployment rate
(right-hand axis)
2012
2013
2014
2015P
2016P
3,8
1,1
8,2
11,3
17,9
19,9
21,4
24,8
26,1
24,1
22,2
20,2
-3,6
0
-1
-2,6
-1,7
1,4
3,2
2,8
1. Strategic lines|
Economic and regulatory enviroment|
Building the future|
Business lines 2. Financial information|
Activity|
Income Statement | Capital base|
Ratings 3. Business risk|
The risk function at Cecabank03 Our Business Model